Text Formatting In the Terminal
Categories:
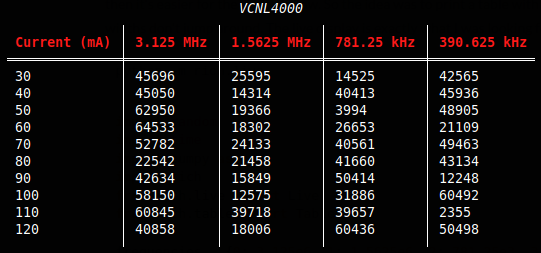
Rich Table
I wanted to share a useful python library that I finally remembered to use after staring it while browsing Github awhile ago. Finding a new useful library can be incredibly invigorating, sometimes it’s a waste of time, but the other times! The ‘Rich’ library falls into the invigorating category.
- Name: Rich
- Purpose: Terminal display tools.
- Why I Like It: Fast, pretty, and extensible output formatting for scripts.
- Pypi: https://pypi.org/project/rich/
- Github: https://github.com/Textualize/rich
- Tutorial I Used: https://rich.readthedocs.io/en/latest/live.html and https://www.codeunderscored.com/format-terminal-using-pythons-rich-library
I love the way this library can make things look with a few lines but that’s not the main draw to me. My goal is an understandable and usable interface, no clutter, and nothing that behaves any differently than what the user expects.
My go to CLI for scripts is click which is a perfect library for handling argument parsing, what I realize now is I’ve been missing easy output formatting which rich handles beautifully. I’ve been looking into using reflection with lock-in detection for detecting cruding up of sensor windows. Conveniently Adafruit has a few of the chips I’m interested in available (Adafruit VCNL4000). I wanted a way to step through the sample frequency and the LED drive current to see if I could improve the first surface reflection off the window. This is a 2D problem so doesn’t lend itself well to my typical approach of:
print("\t".join(np.array(a, dtype=str)))
Following my new years resolution to look for a library before I go off and write a new version of the same thing, I tried out rich and was back to the actual work at hand. Specifically I wanted to print a table that would stay on the same part of the screen. If the table doesn’t move when updated then it’s easier for the eye to follow. So the idea was to print a table with white space packing so the values and column widths don’t jump around. The live display is exactly what I was looking for to do this. There’s a useful demo that’s included:
python -m rich.live
Setting up the live table is straight forward:
import random
import time
import numpy as np
import rich
from rich.live import Live
from rich.table import Table

frequencies = {0: 3.125e6, 1: 1.5625e6, 2: 781.25e3, 3: 390.625e3}
current_settings = np.arange(30, 130, step=10, dtype=int)


def read_sensor() -> int:
  """Stub generating random values covering the sensor range"""
  bits = 16
  return random.randint(0, 2**bits)


def generate_table() -> Table:
  """Make a new table."""
  table = Table(title="VCNL4000", box=rich.box.MINIMAL_DOUBLE_HEAD)
  table.add_column("Current (mA)")
  scales = ((0, ''), (1e3, 'k'), (1e6, 'M'))

  for key in frequencies:
    frequency = frequencies[key]
    scale = scales[0]
    for p in scales:
      if frequency > p[0]:
        scale = p

    table.add_column("{} {}Hz".format(frequency/scale[0], scale[1]))

    for i in current_settings:
      row = [i]
      for f in frequencies:
        reading = read_sensor()
        row.append(reading)
    table.add_row(*np.array(row, dtype=str))
  return table


  with Live(generate_table(), refresh_per_second=4) as live:
    while True:
      time.sleep(0.4)
      live.update(generate_table())
Summary
The rich library adds a lot of value with very little code. If you’re doing anything in the terminal—especially for development tools or diagnostics—it’s worth checking out.